科研相关图片绘制
0. 概述
1. Python绘制地图
1.1 地图绘制三方库介绍
Cartopy介绍
Cartopy官方介绍网页:Introduction — cartopy 0.24.1 documentation
Cartopy是一个Python包,用于地理空间数据处理,以便生成地图和其他地理空间数据分析。 Cartopy利用了强大的PROJ.4、NumPy和Shapely库,并在Matplotlib之上构建了一个编程接口,用于创建发布高质量的地图。
Cartopy的主要特点是面向对象的投影定义,以及在投影之间转换点、线、向量、多边形和图像的能力。
Cartopy 安装
1.使用pip安装
安装稳定版本:
安装最新版本:
1 pip install git+https://github.com/SciTools/cartopy.git
2.使用conda安装
1 conda install -c conda-forge cartopy
3.使用源码安装(Linux)
1
2
3
4
5
git clone https://github.com/SciTools/cartopy.gitcd cartopy
4.依赖库安装
1
2
3
4
5
git clone https://github.com/SciTools/cartopy.gitcd cartopyenv create -f environment.yml
1.2 绘制世界地图 以官方的算例为例:Global Map — cartopy 0.16.0 documentation
算例的代码为:
1
2
3
4
5
6
7
8
9
10
11
12
13
14
15
16
17
18
19
20
21
22
23
24
25
import matplotlib.pyplot as pltimport cartopy.crs as ccrsdef main ():10 , 5 ))1 , 1 , 1 , projection=ccrs.Robinson())0.08 , 51.53 , 'o' , transform=ccrs.PlateCarree())0.08 , 132 ], [51.53 , 43.17 ], transform=ccrs.PlateCarree())0.08 , 132 ], [51.53 , 43.17 ], transform=ccrs.Geodetic())if __name__ == '__main__' :
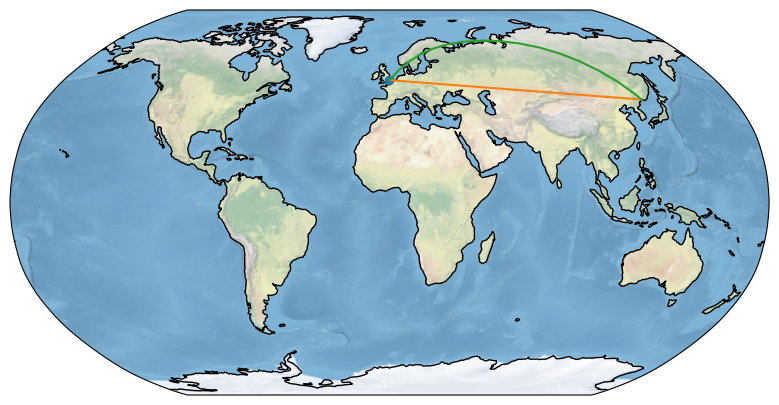
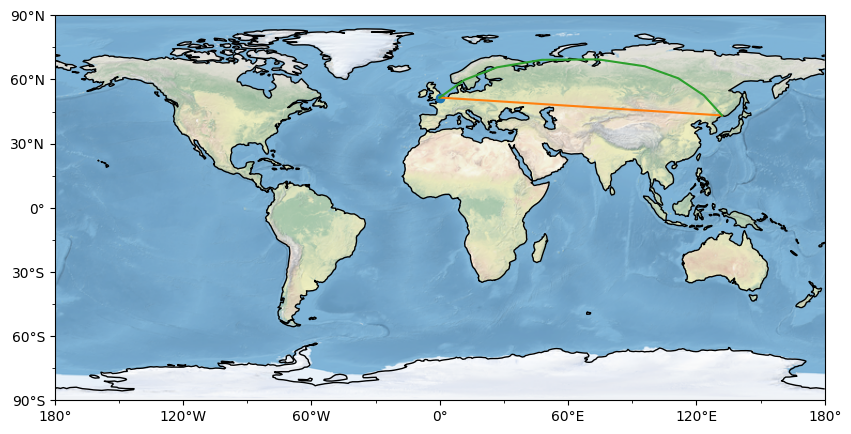
算例的效果为:
这个算例中,绘制地图的代码为这句ax = fig.add_subplot(1, 1, 1, projection=ccrs.Robinson()),其中修改最多的参数为地图投影函数,projection=ccrs.PlateCarree(),分别有如下几个选择:
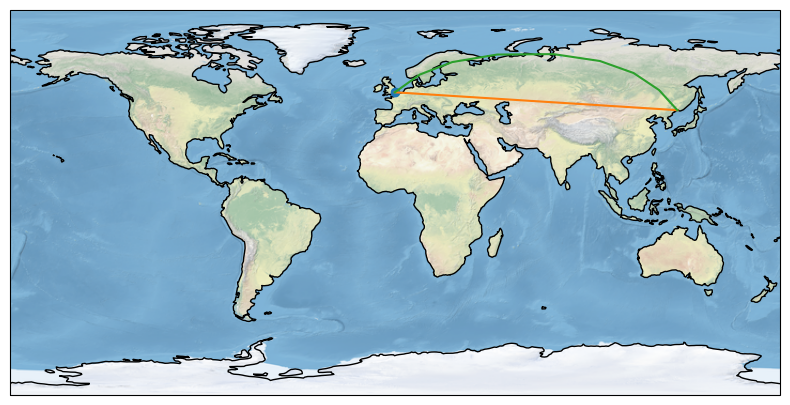
1.projection=ccrs.PlateCarree(),绘制效果为:
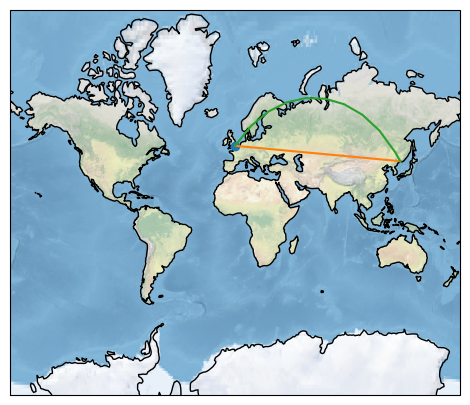
2.projection=ccrs.Mercator(),绘制效果为:
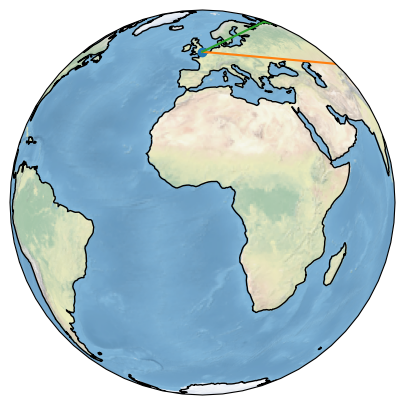
3.projection=ccrs.Orthographic(),绘制效果为:
4. 往地图增加经纬度
修改代码到如下版本:
1
2
3
4
5
6
7
8
9
10
11
12
13
14
15
16
17
18
19
20
21
22
23
24
25
26
27
28
29
30
31
32
33
34
35
36
37
38
39
40
41
42
import matplotlib.pyplot as pltimport cartopy.crs as ccrsimport numpy as npfrom cartopy.mpl.ticker import LongitudeFormatter, LatitudeFormatterdef main ():10 , 5 ))1 , 1 , 1 , projection=ccrs.PlateCarree())0.08 , 51.53 , 'o' , transform=ccrs.PlateCarree())0.08 , 132 ], [51.53 , 43.17 ], transform=ccrs.PlateCarree())0.08 , 132 ], [51.53 , 43.17 ], transform=ccrs.Geodetic())180 , 180 + 60 , 60 ), crs=tick_proj)180 , 180 + 30 , 30 ), minor=True , crs=tick_proj)90 , 90 + 30 , 30 ), crs=tick_proj)90 , 90 + 15 , 15 ), minor=True , crs=tick_proj)if __name__ == '__main__' :
我自己的测试,在**projection=ccrs.PlateCarree()**的时候才不会报错,其他投影方式无法正常运行通过,最终的运行效果如下:
后续,有其他需求,类似绘制全球测站点分布或者其他需求,在上述代码的基础上修改即可。
1.3 绘制中国地图
cartopy方法 网上有很多教程,这里需要注意的是,使用官方的数据库会出现国家线缺失的问题 。这里需要对相应部分进行修改,确保绘制的中国地图没有领土缺失 。
我的数据是从这下载的CN-border-La.dat文件:gmt/CN-border-La.dat at master · shineusn/gmt
最后实现的代码是:
1
2
3
4
5
6
7
8
9
10
11
12
13
14
15
16
17
18
19
20
21
22
23
24
25
26
27
28
29
30
31
32
33
34
35
36
37
38
39
40
41
42
43
44
45
46
import numpy as npimport matplotlib.pyplot as pltimport cartopy.crs as ccrsimport cartopy.feature as cfeaturewith open (rf'CN-border-La.dat' ) as src:for cnt in context.split('>' ) if len (cnt) > 0 ]float , sep=' ' ) for block in blocks]8 , 8 ])90 ,105 ))'50m' ))'50m' ))'50m' ))'50m' ))for line in borders:0 ::2 ], line[1 ::2 ], '-' , color='gray' ,transform=ccrs.Geodetic())'--' )80 , 130 , 13 , 55 ])0.741 , 0.11 , 0.14 , 0.155 ],90 ,115 ))'50m' ))'50m' ))'50m' ))'50m' ))for line in borders:0 ::2 ], line[1 ::2 ], '-' , color='gray' ,105 , 125 , 0 , 25 ])
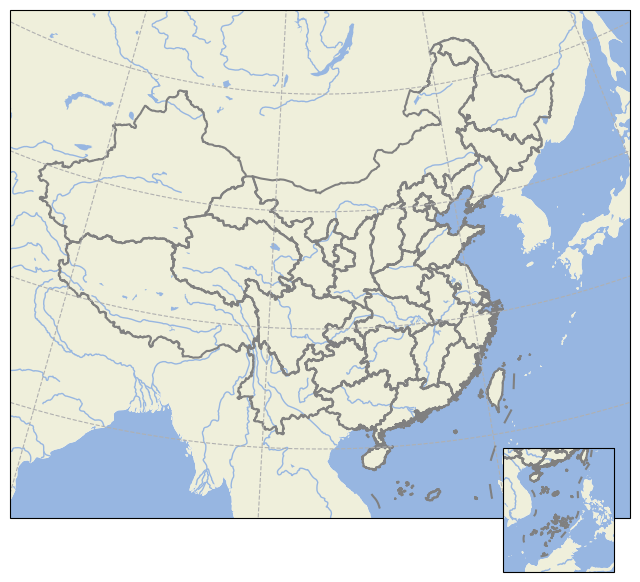
最后绘制效果是:
basemap方法 基础代码如下:
1
2
3
4
5
6
7
8
9
10
11
12
13
14
15
16
17
18
19
20
21
22
23
24
25
26
27
28
29
30
import matplotlib.pyplot as pltfrom mpl_toolkits.basemap import Basemap12 , 8 ))'merc' , llcrnrlat=18 , urcrnrlat=54 , llcrnrlon=73 , urcrnrlon=135 , resolution='i' )'lightgray' , lake_color='aqua' )'aqua' )range (0 , 360 , 10 ), labels=[True , False , False , True ])range (-90 , 90 , 10 ), labels=[False , True , True , False ])73 , 135 , 135 , 73 , 73 ]18 , 18 , 54 , 54 , 18 ]None , color='m' )'Map of China' )
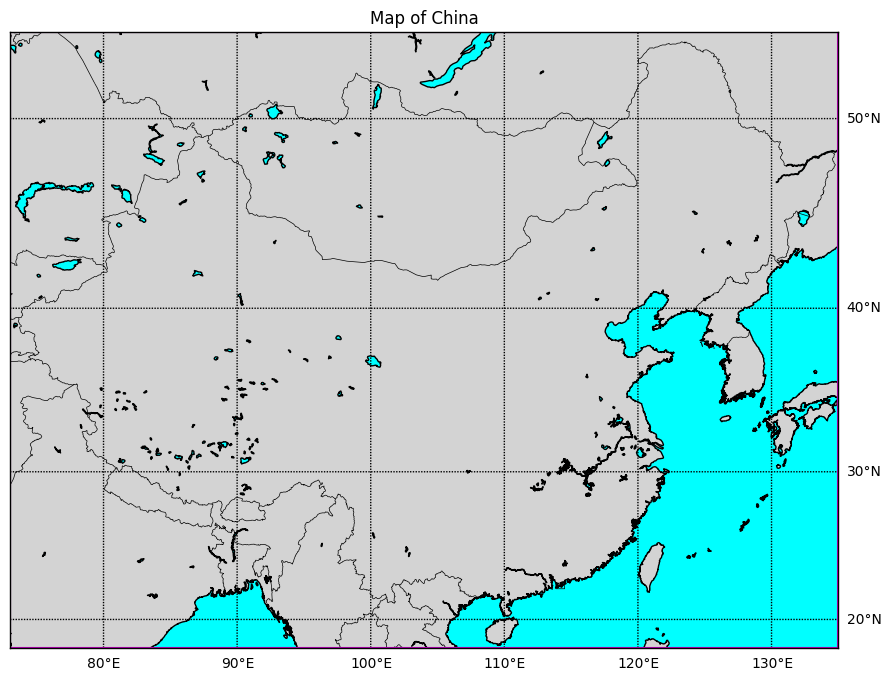
绘制效果如下:
folium方法 代码如下:
1
2
3
4
5
6
7
8
9
10
11
12
13
14
import folium35.8617 , 104.1954 ], zoom_start=4 )35.8617 , 104.1954 ],'China' ,'cloud' )'china_map.html' )
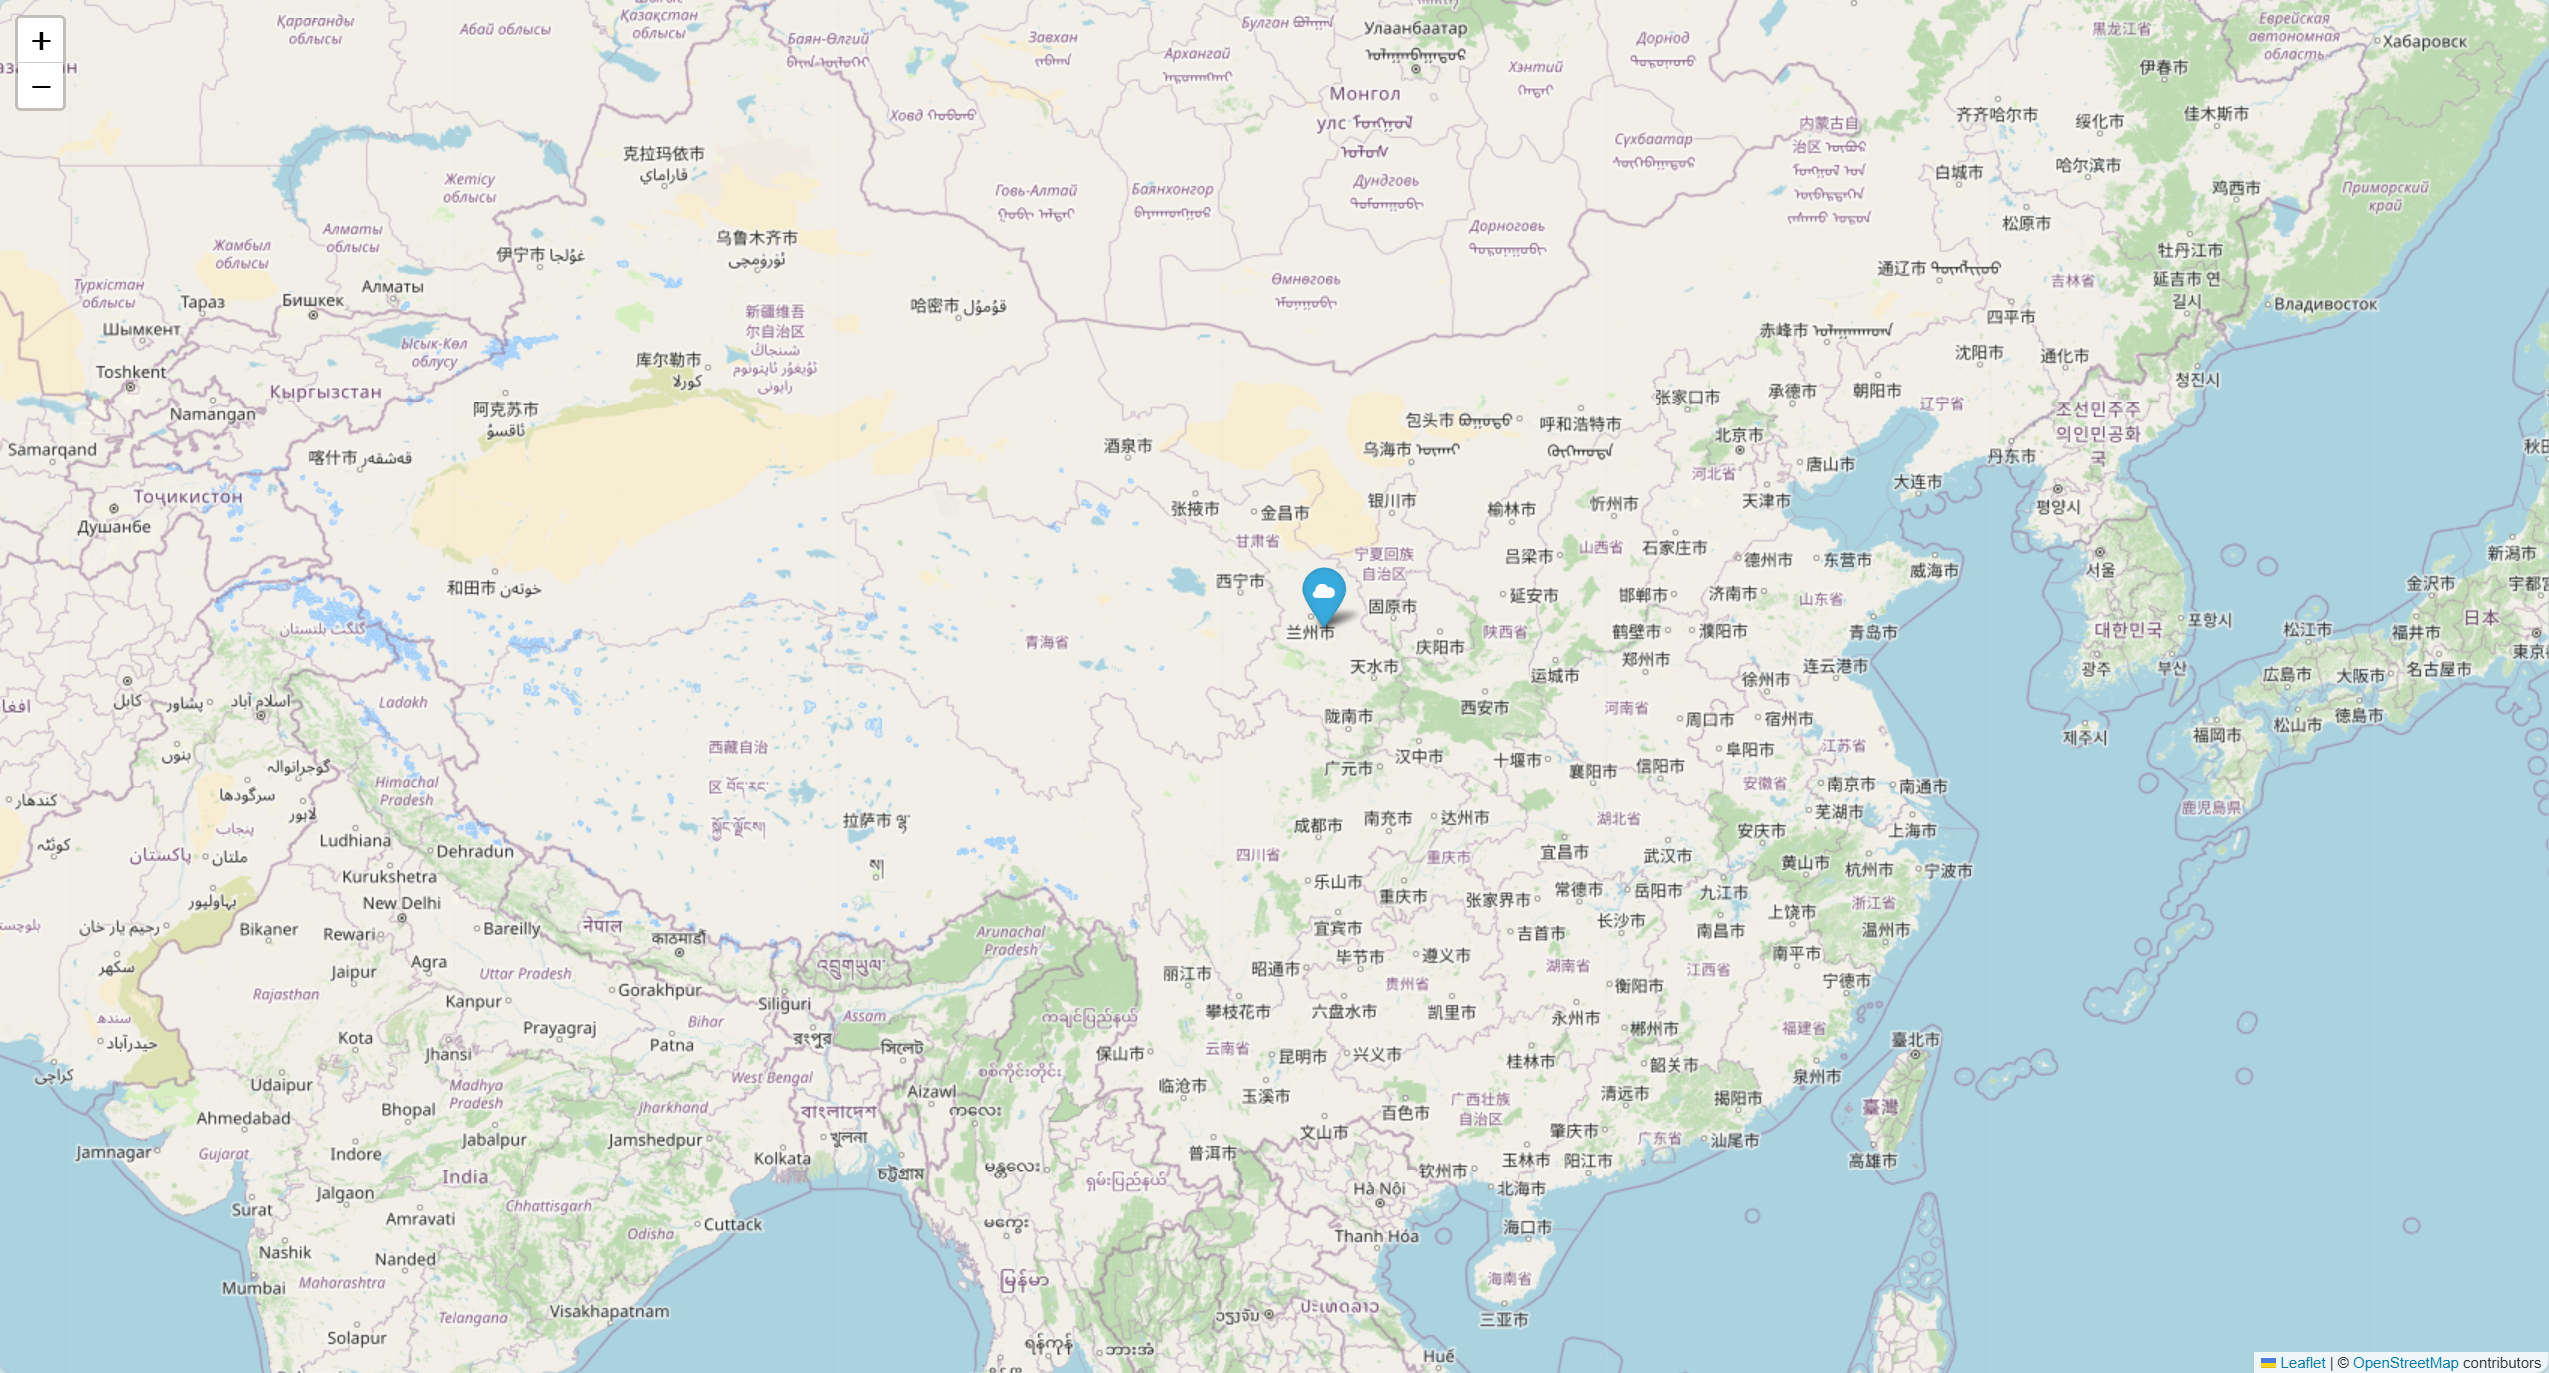
效果如下:
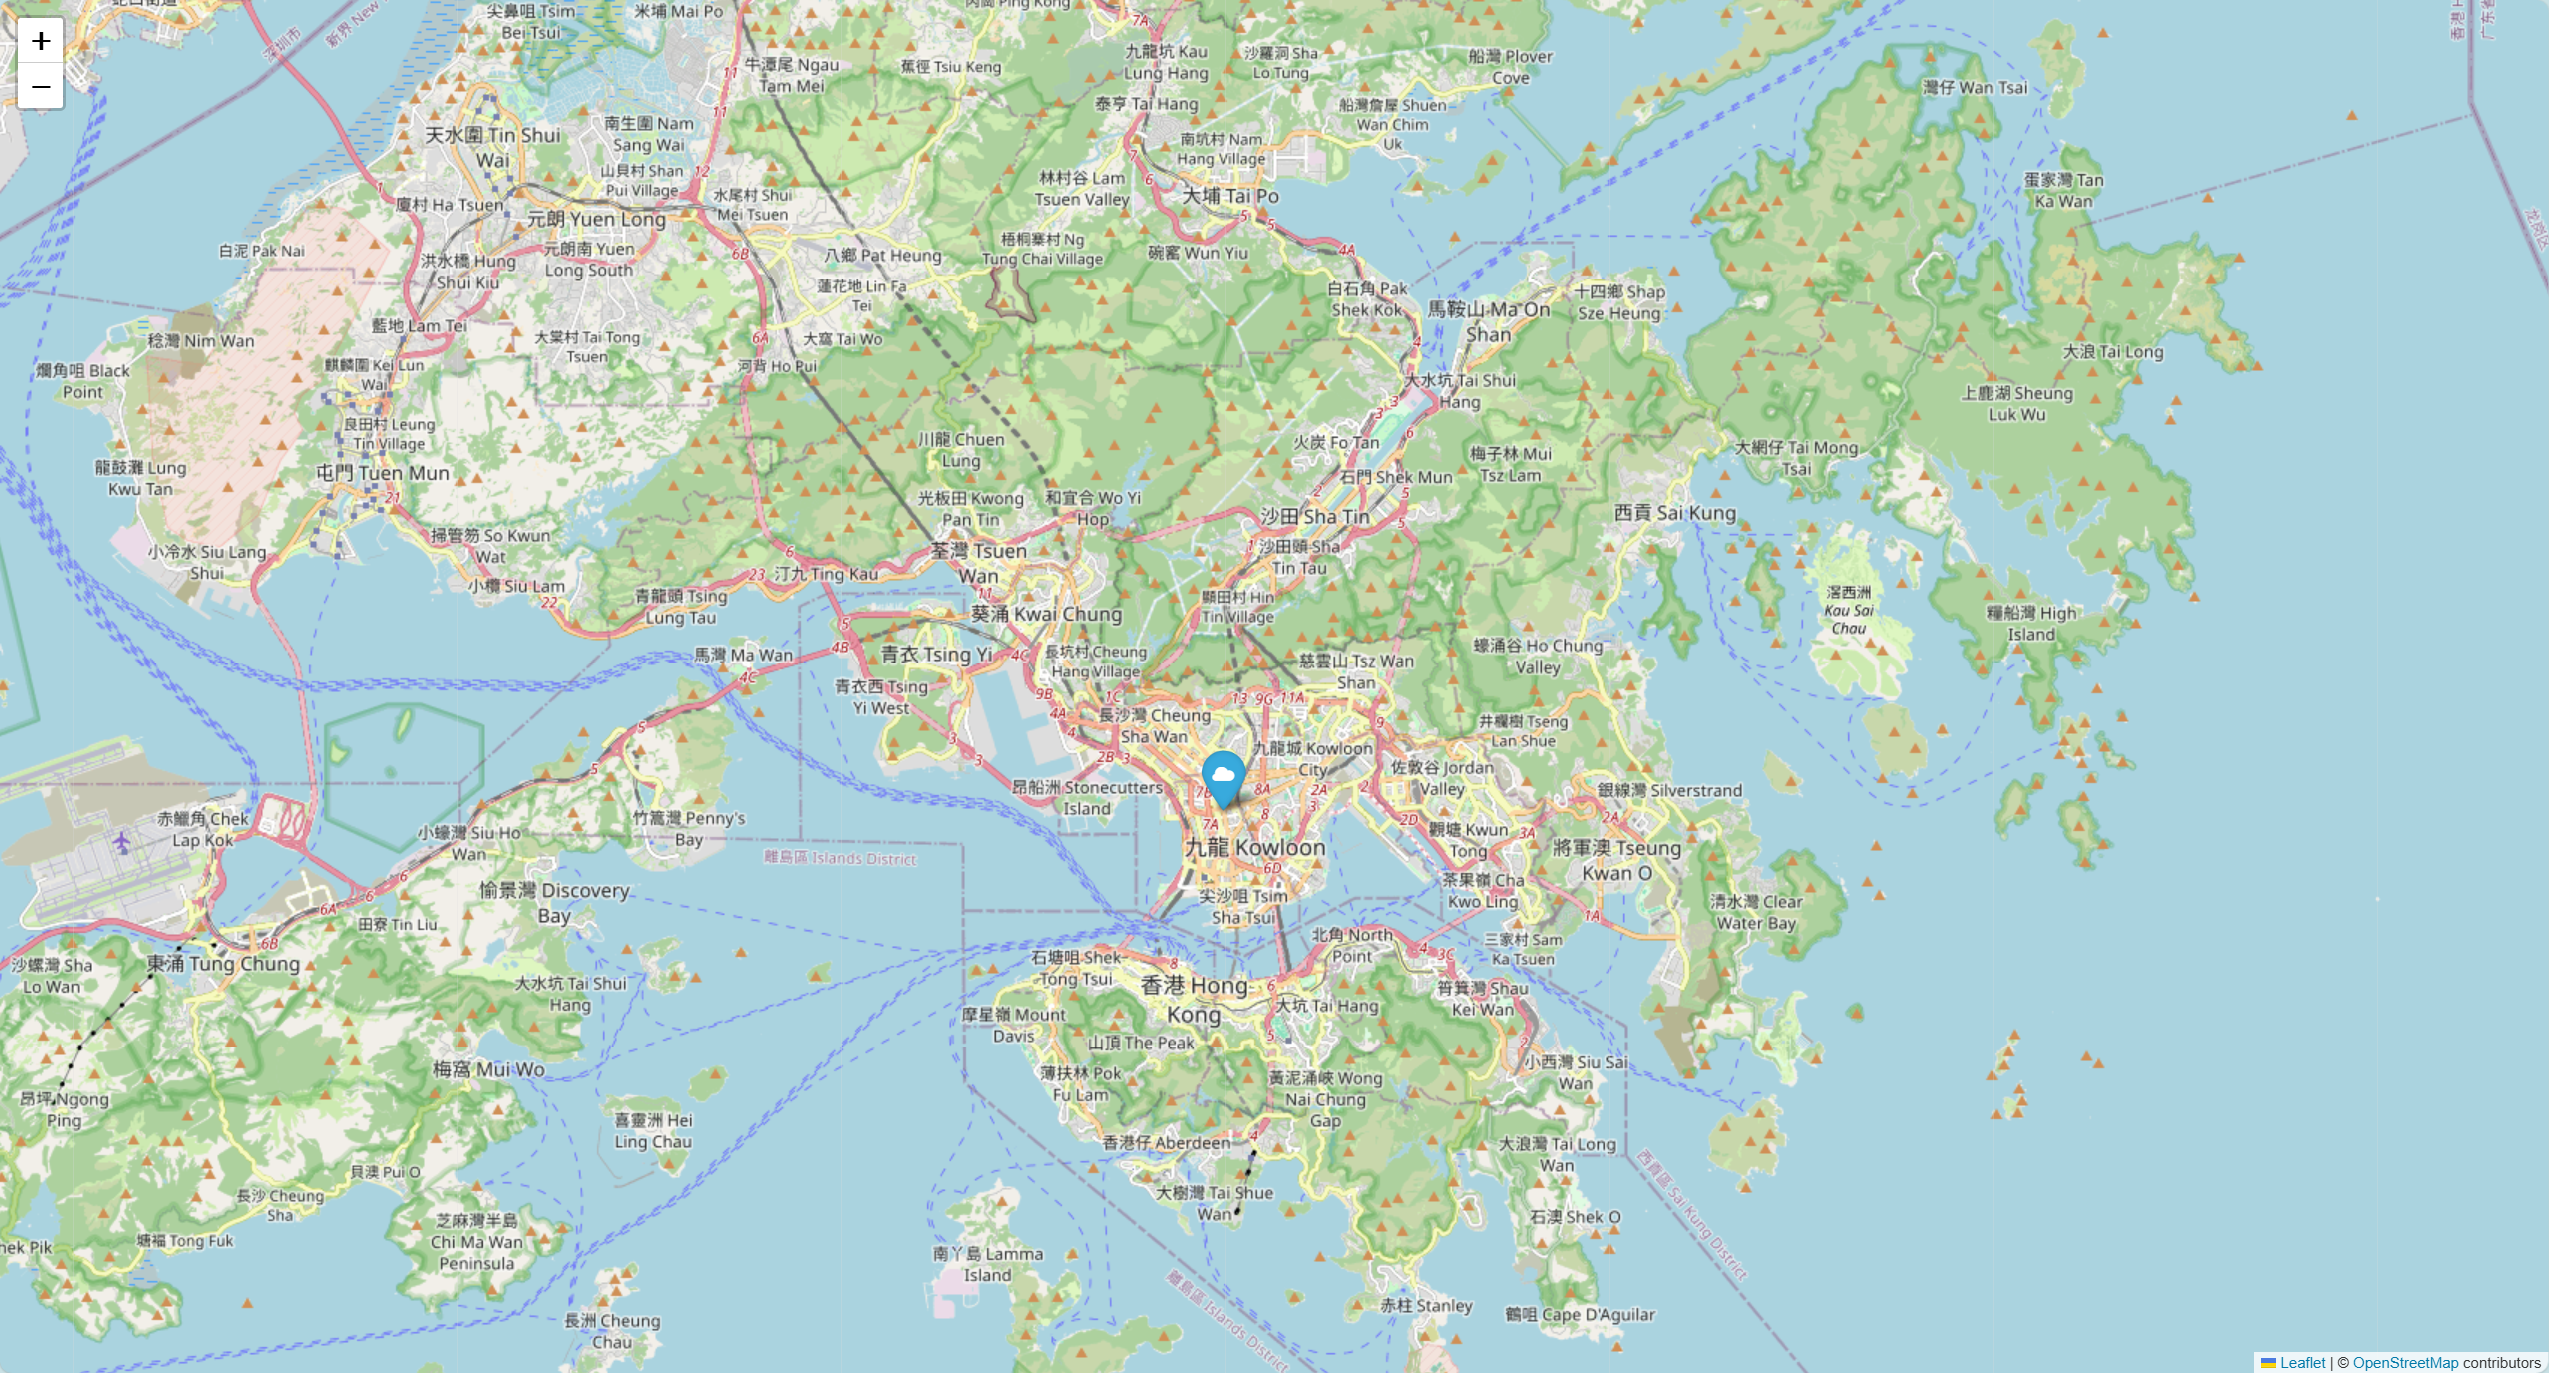
1.3 绘制香港地图
folium方法 代码如下:
1
2
3
4
5
6
7
8
9
10
11
12
13
14
import folium22.3193 , 114.1694 ], zoom_start=12 )22.3193 , 114.1694 ],'Hong Kong' ,'cloud' )'hong_kong_map.html' )
效果如下:
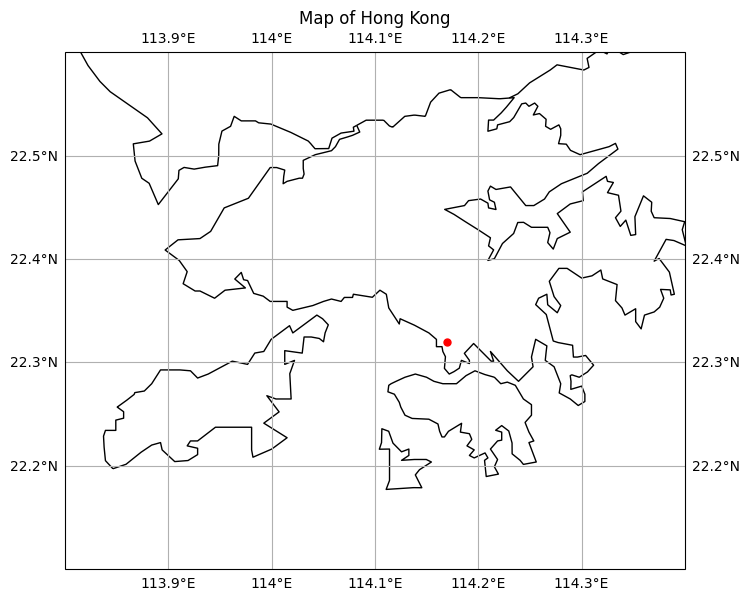
cartopy方法 代码如下:
1
2
3
4
5
6
7
8
9
10
11
12
13
14
15
16
17
18
19
20
21
22
23
24
import matplotlib.pyplot as pltimport cartopy.crs as ccrsimport cartopy.feature as cfeature8 , 8 ))1 , 1 , 1 , projection=ccrs.PlateCarree())'10m' )True )113.8 , 114.4 , 22.1 , 22.6 ])114.1694 , 22.3193 , marker='o' , color='red' , markersize=5 )'Map of Hong Kong' )
效果如下:
2. Python绘制colorbar
2.1 float list转color list
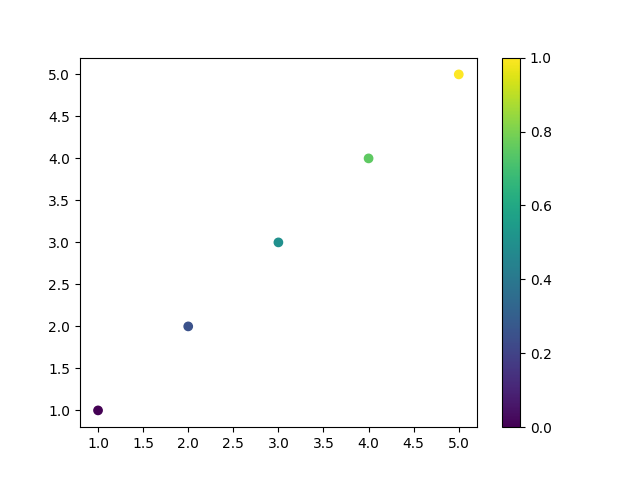
可以使用 matplotlib 中的 Normalize 和 cm 模块将 float 列表转换为颜色列表,并将其应用于 scatter 图。以下是一个示例代码:
1
2
3
4
5
6
7
8
9
10
11
12
13
14
15
16
17
18
import matplotlib.pyplot as pltimport matplotlib.cm as cmimport matplotlib.colors as mcolors0.1 , 0.2 , 0.3 , 0.4 , 0.5 ]min (float_list), vmax=max (float_list))1 , 2 , 3 , 4 , 5 ], [1 , 2 , 3 , 4 , 5 ], c=color_list)
这个示例代码将 float_list 中的值归一化,然后使用 viridis colormap 将其映射为颜色,并在 scatter 图中使用这些颜色。你可以根据需要更改 colormap, viridis 只是其中之一。
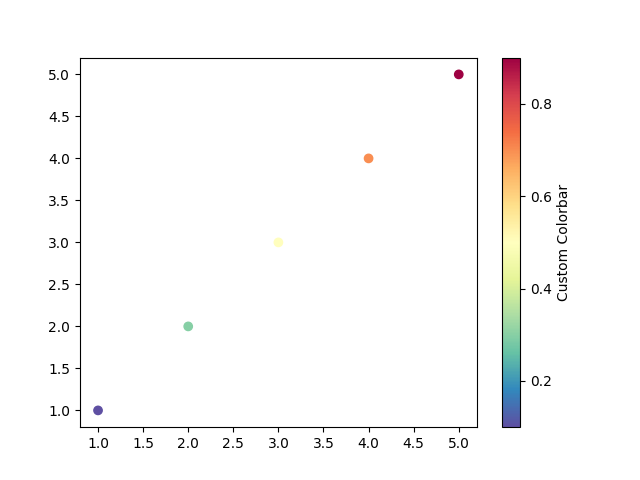
如果希望换一个风格,可以修改代码中的color_list = cm.viridis,示例代码如下:
1
2
3
4
5
6
7
8
9
10
11
12
13
14
15
16
17
18
19
20
21
22
23
import matplotlib.pyplot as pltimport matplotlib.colors as mcolorsimport numpy as np0.1 , 0.3 , 0.5 , 0.7 , 0.9 ]min (float_list), vmax=max (float_list))1 , 2 , 3 , 4 , 5 ]1 , 2 , 3 , 4 , 5 ]0 , 0.2 , 0.4 , 0.6 , 0.8 , 1 ])'Custom Colorbar' )
实际绘制效果为:
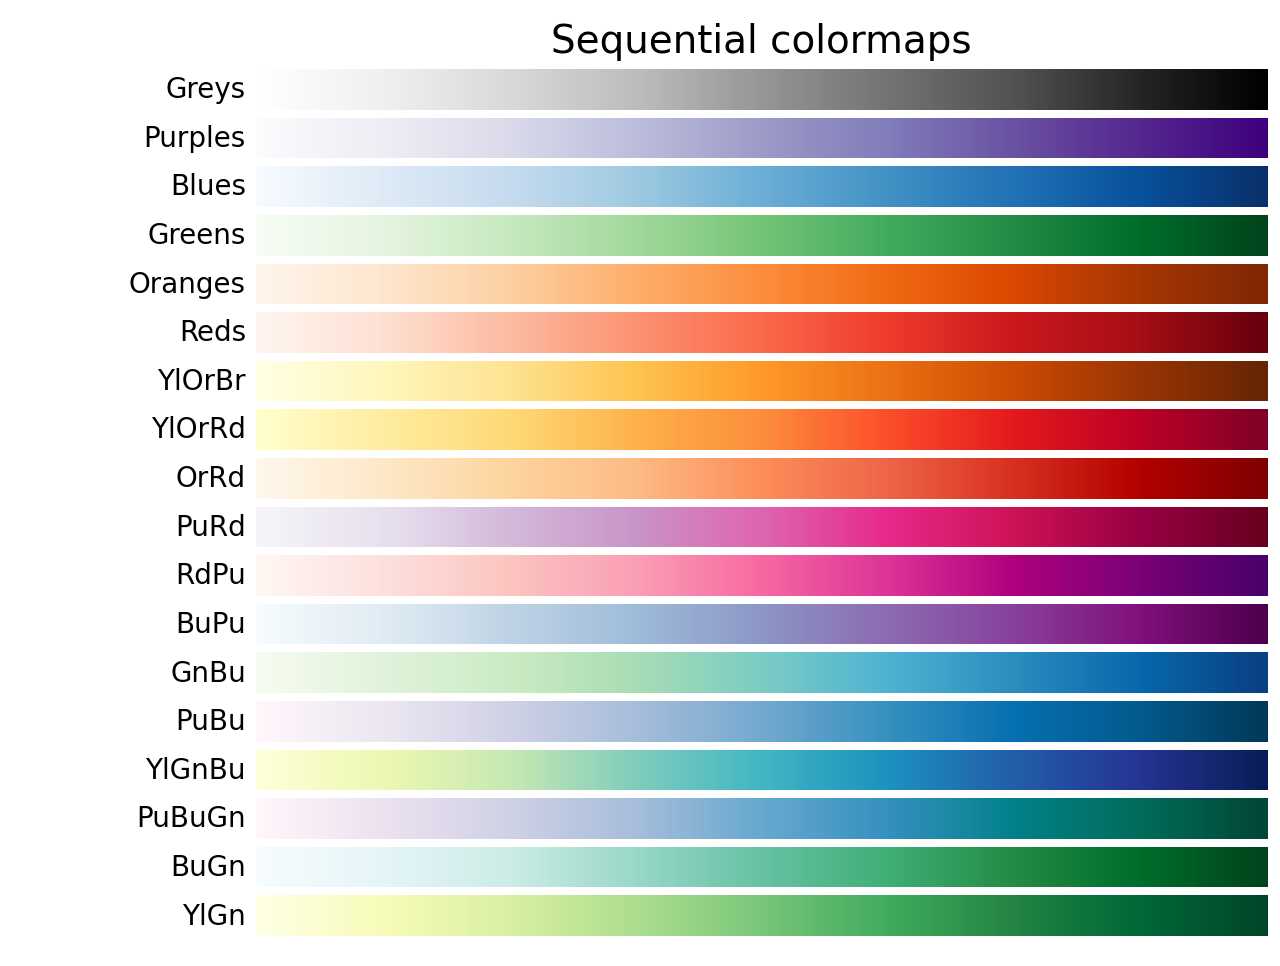
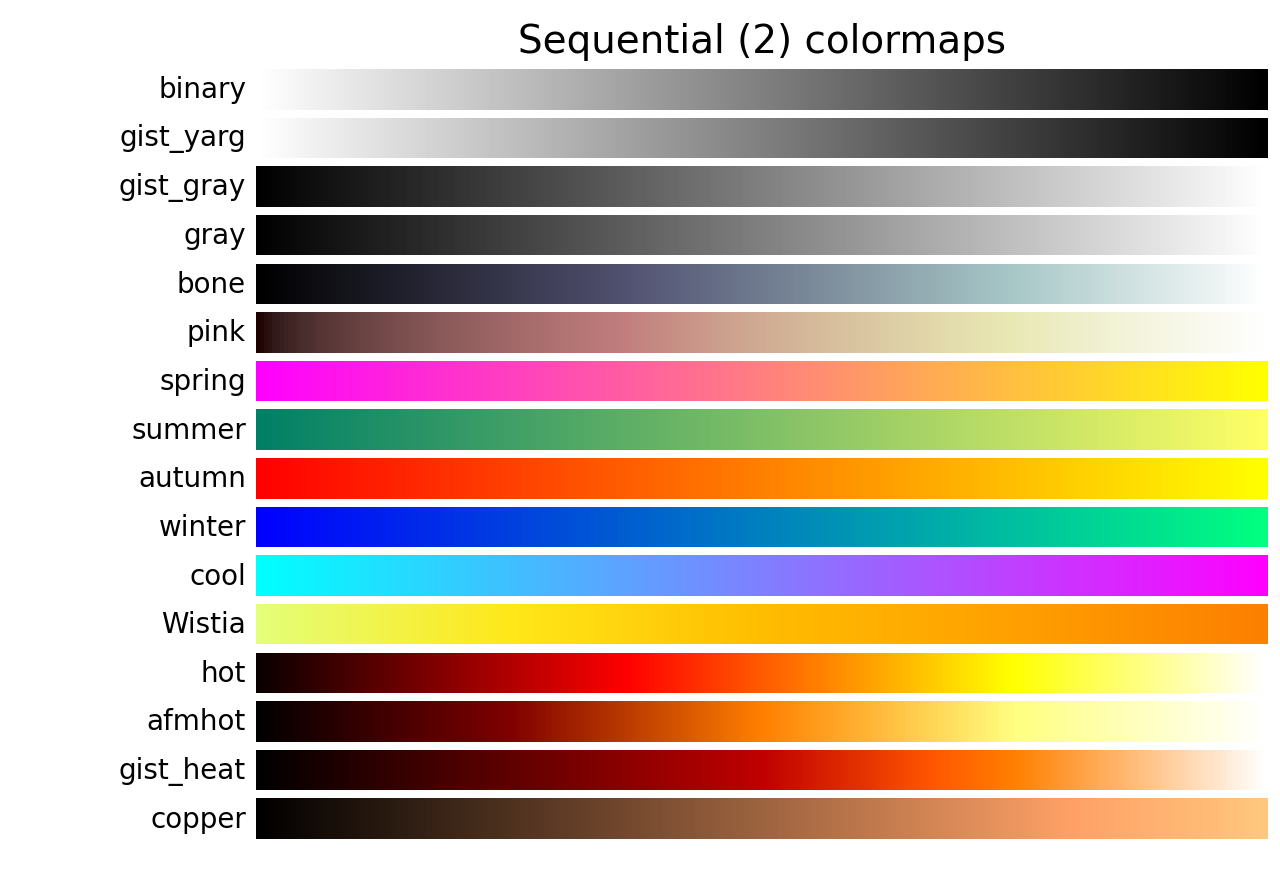
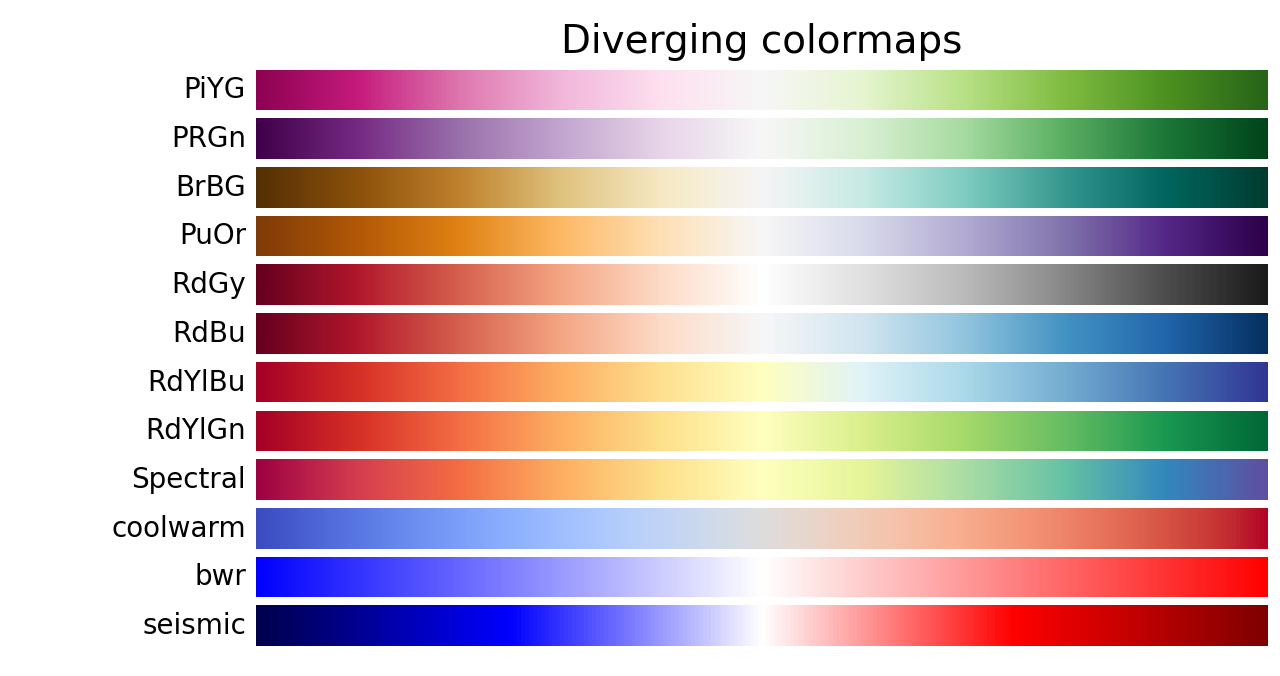
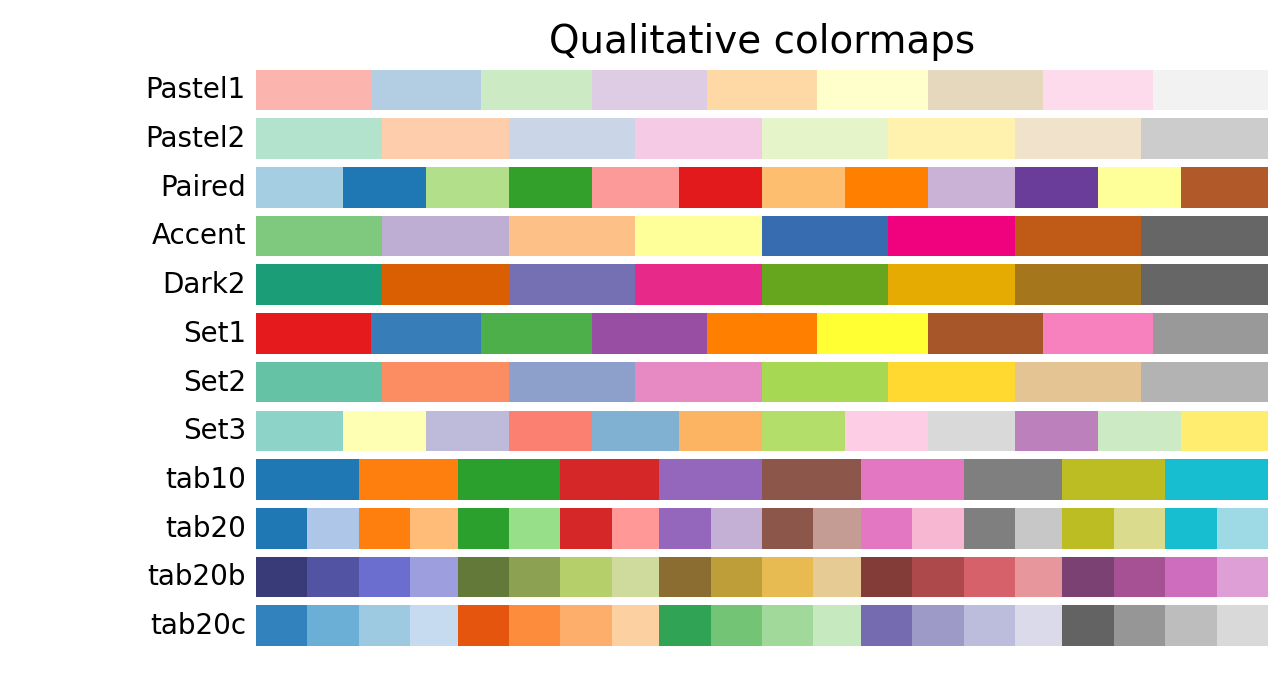
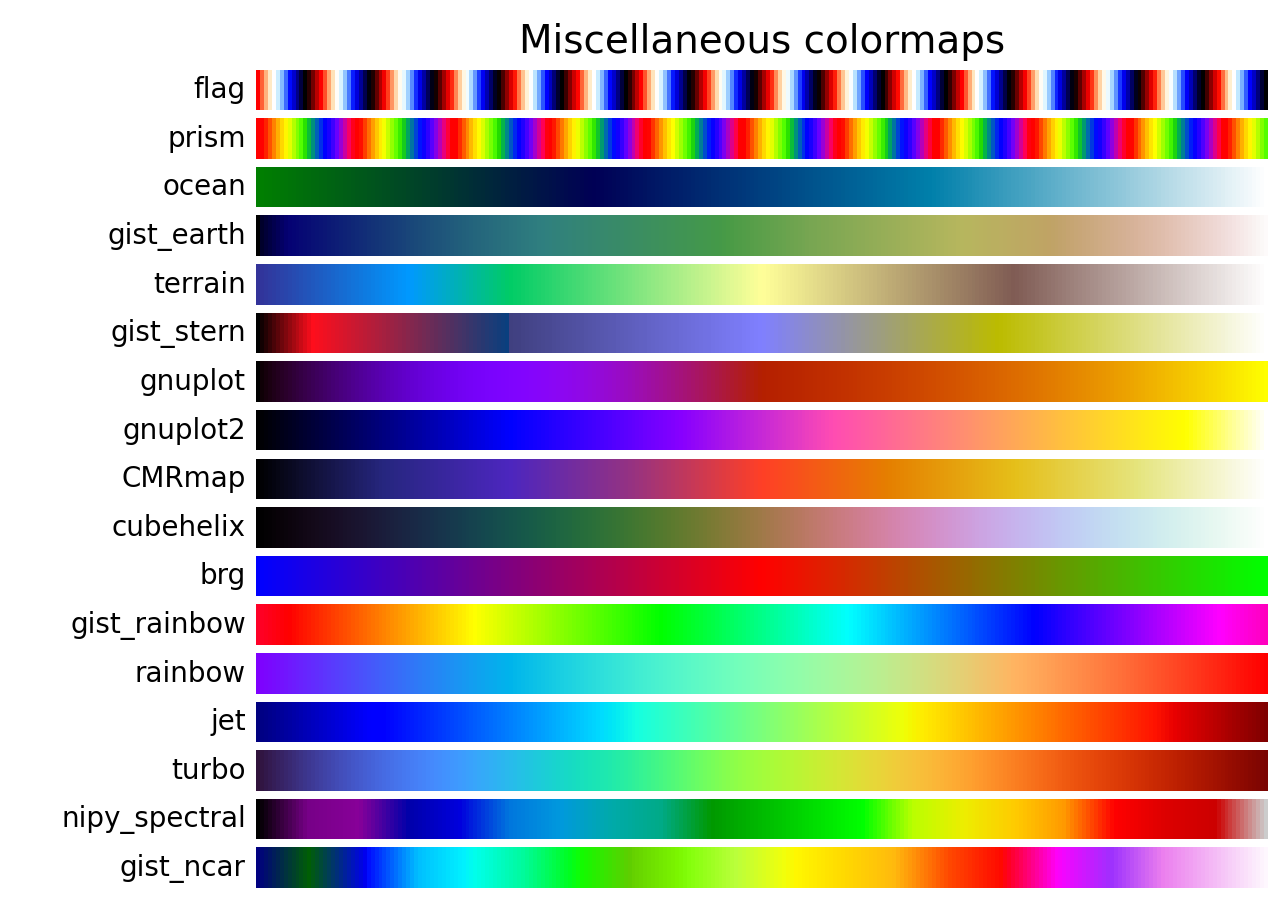
如果想要切换风格,就更换plt.cm.Spectral_r,其中_r是颜色翻转,可以参考如下样例选取:
3. PPT绘制图片
3.1 PPT另存为图片的分辨率设置
有些别人制作的PPT,我们觉得里面的图片搭配得还不错,想把它导出来电脑保存,可是每次导出或另存为PPT图片的时候,都会模糊了。这是因为PPT另存为图片的分辨率是有限制的,改掉这些限制需要在注册表中进行修改。
步骤如下:
按 Win + R 组合键,打开运行窗口,输入并确定或回车执行 regedit 命令,可以快速打开注册表编辑器
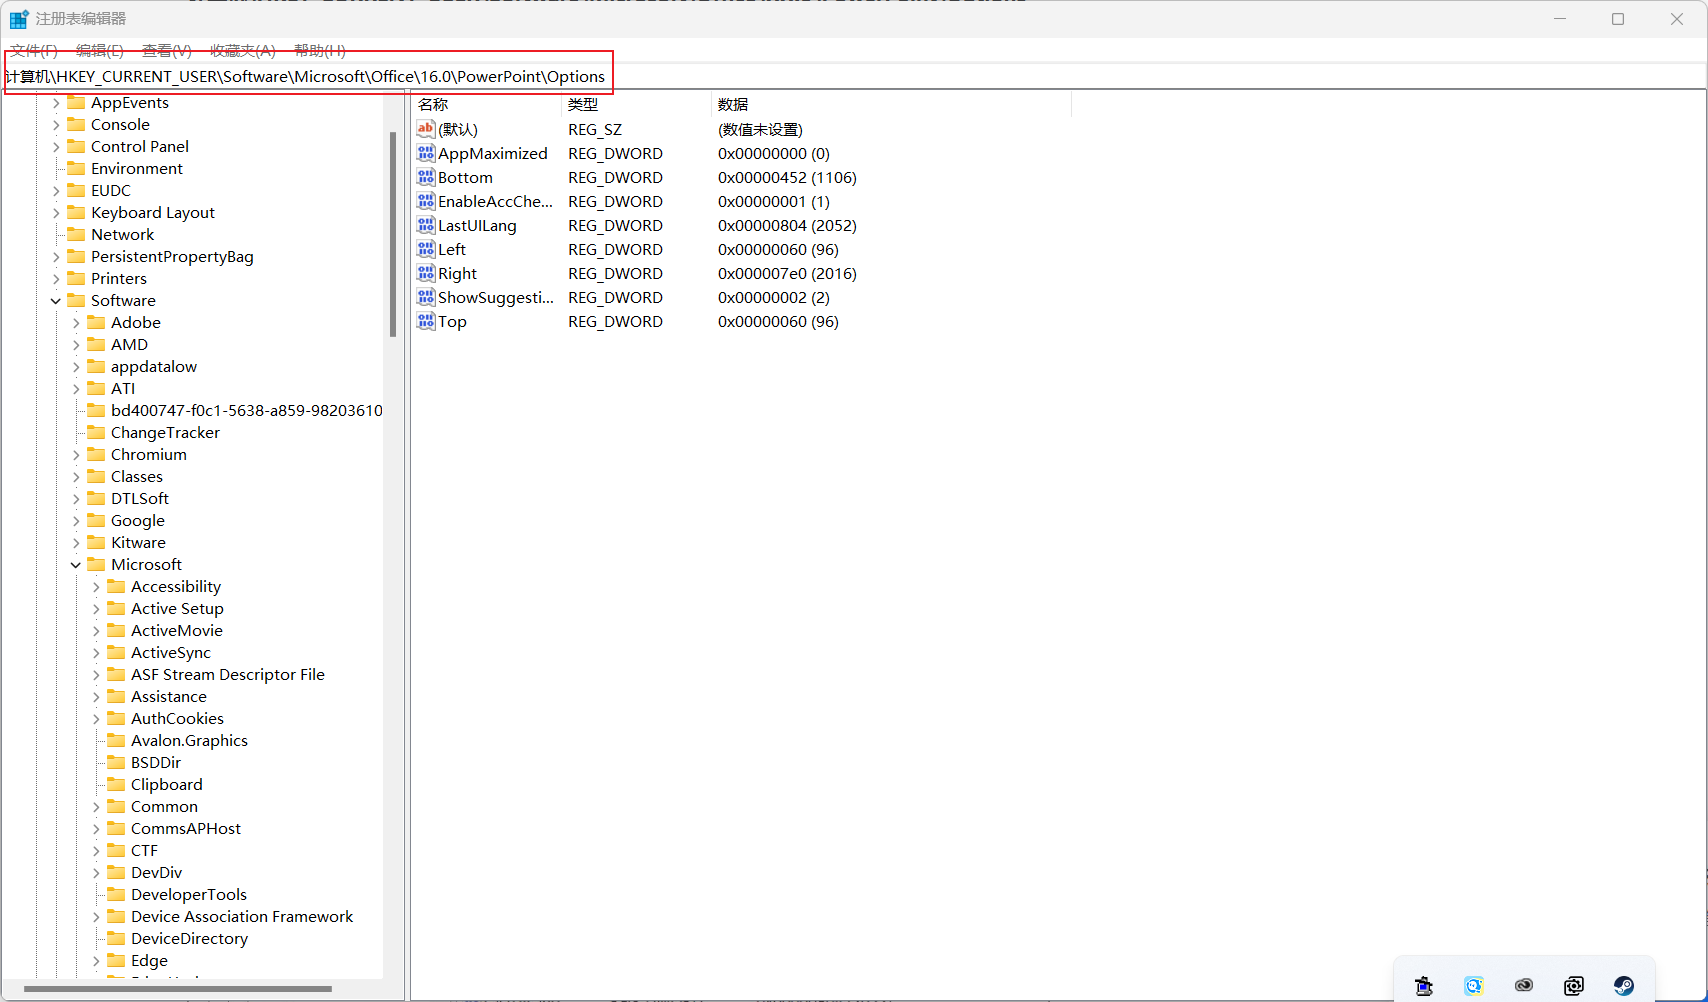
注册表编辑器窗口中,依次展开到以下路径:
计算机\HKEY_CURRENT_USER\Software\Microsoft\Office\XX.0\PowerPoint\Options
注册表路径中的 XX 代表 office 版本号,例如2010版本号14、2013版本号为15、2016版本号为16
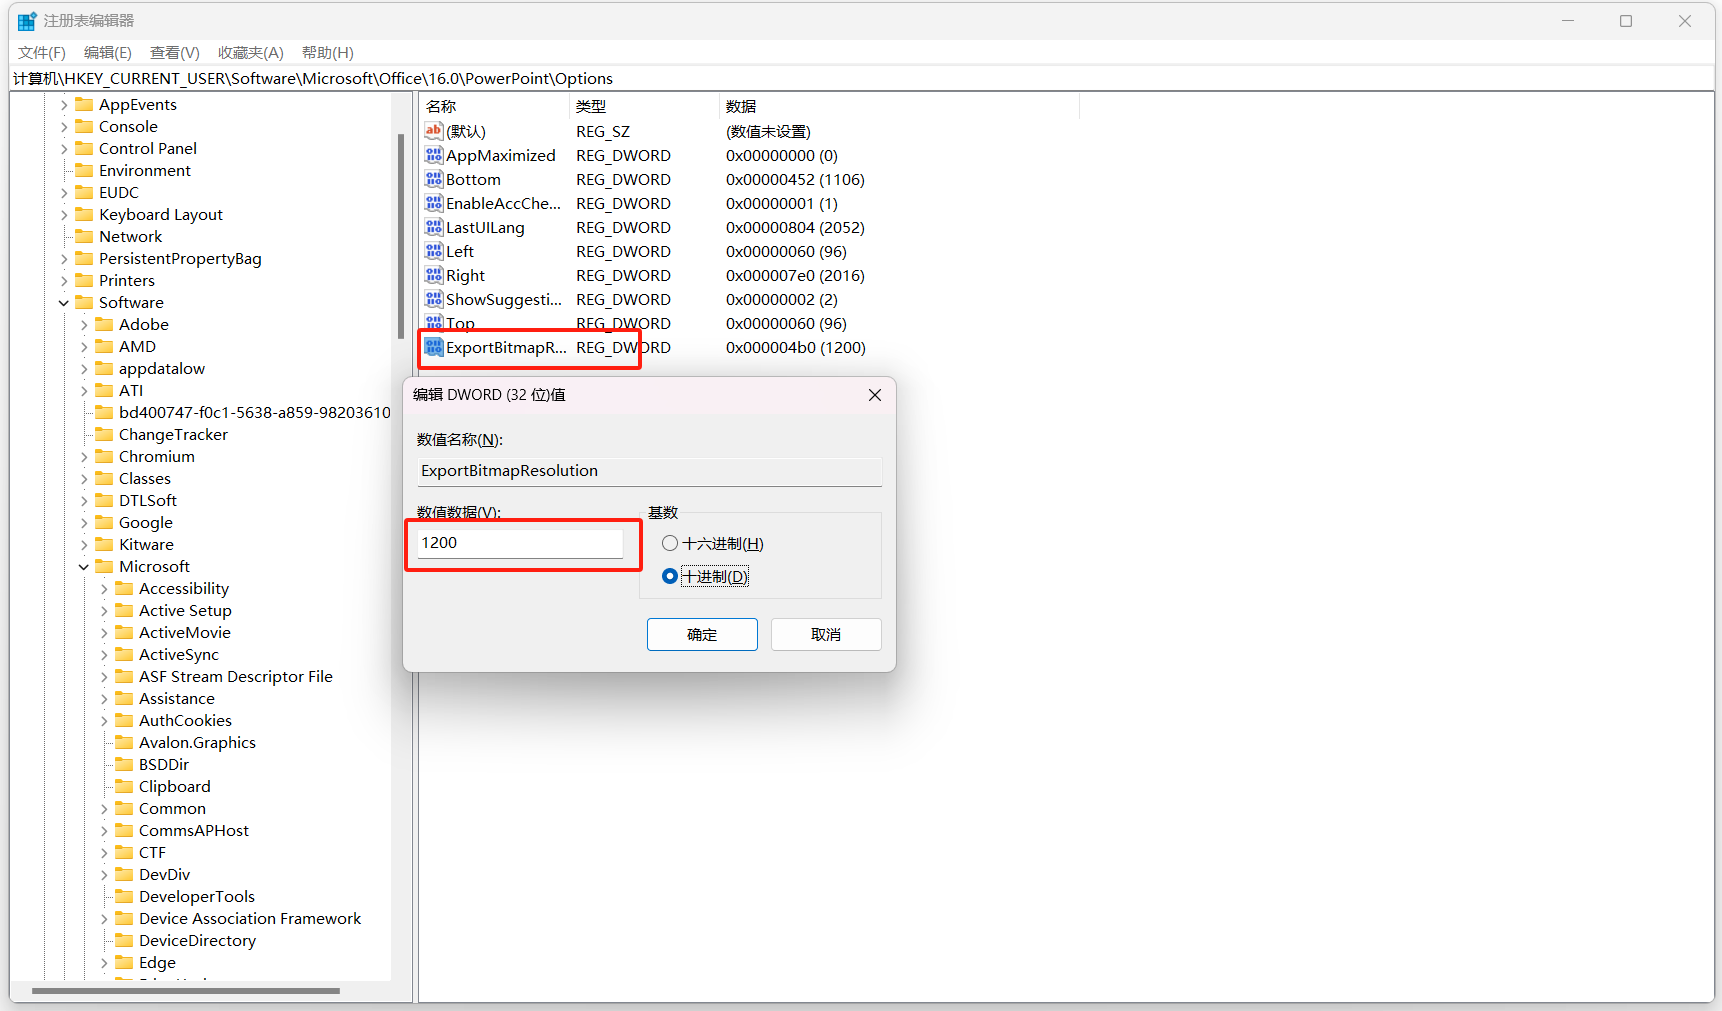
左侧点击 Options ,然后在右侧空白处,点击右键,新建一个 DWORD (32 位)值(D);
新建的这个值,命名为ExportBitmapResolution 后双击打开,修改基数为“十进制”,修改数值为“1200”,大约相当于2K分辨率,已经足够清晰了;
确定保存注册表后,重启电脑即可应用更改,这时保存PPT中的图片就会非常清晰了;
